TWS 981 Release Notes
Trade Your Way to the World You Want
Interactive Brokers is dedicated to helping you make better investment decisions. In 2018 we introduced Refinitiv Environmental, Social and Corporate Governance (ESG) metrics to provide transparency into company policy and its non-financial effects. Recently we enhanced ESG to allow you to be notified when companies engage in activities counter to your values.
Now we've expanded our responsible investing offerings even more with the interactive Impact Dashboard, which incorporates a new data source from TruValue Labs that scores companies against the Sustainability Account Standards Board (SASB) criteria.
Use the Impact Dashboard to evaluate and potentially adjust your portfolio to invest in companies whose responsible world view coincides with your own. Choose the impact values and principles that are important to you, like Racial Equality and No Animal Testing. Then let the Impact Dashboard analyze and grade your portfolio based on how your positions align with your principles. The dashboard even shows how each individual investment is helping or hurting your overall Portfolio Impact Score .By viewing companies through an "impact lens" of your own design, you can clearly see whether their socially-responsible goals and principles line up with yours.
To open the Impact Dashboard
- In Mosaic: Use the Impact button in the Portfolio or from the New Window drop-down select Impact Dashboard.
- In Classic: Use the Impact icon in the menu bar.
To use the Impact Dashboard
Follow the prompts to set up your dashboard.
- Click to select the values that are important to you, and click a value again to tag it as "Very Important." Once you have made your selections, click Next to tag the practices you want to avoid. Read more about any value by clicking About.
Note: To make your Impact Score more meaningful, be sure to limit your selections to the values that are most important to you. They are used in the calculation of your Portfolio Impact Score, and the more values you select, the less impact each value has on your score.
- Click to select all of the Environmental, Social and Governance (ESG) practices to which you're opposed.
Note: These practices are not used in the Portfolio Impact Score calculation. Instead, we will "red flag" companies that engage in these practices so that you can avoid them if you want.
Understanding your Score
Once your selections are made we'll use this information along with the available impact data to analyze your portfolio and provide you with your interactive Portfolio Impact Score.
- Your Portfolio Impact Score is presented in the center of the chart. Directly under the chart we tell what percentage of your portfolio provides impact data to help make the grade more meaningful.
- Hold your mouse over a slice of the chart to see the weight each slice holds within the Helping, Hurting and Neutral segments.
- To the right of the doughnut chart see the values and practices you selected as being important:
- Values show a letter grade in the top right corner. This grade identifies how well or how poorly your portfolio performs in this specific area. Select a graded value to see more details that show how your investments contribute to the value grade.
- Flagged practices show a red number in the upper right corner. This indicates how many companies in your portfolio engage in specific practice. Select a flagged practicde to see which companies in your portfolio engage in that practice.
- Below the chart see the list of all of your positions with the Impact Effect, Industry, Analyst Rating and more. Click an instrument to see how going long or selling short would affect your Portfolio Impact Score.
Edit your preferences at any time by clicking the pencil icon next to the Your Preferences title.
Separate the Signal from the Static with Social Sentiment Data
Now you can see current and trending market sentiment scores for companies in your Watchlist, Portfolio and throughout TWS with social sentiment data from Social Market Analytics Inc. (SMA). Data is derived from the content and volume of unique Tweets, which have been triple-filtered for relevance and credibility from the daily Twitter stream of over 500 million Tweets. Social Sentiment scanners coming soon.
Current data coverage includes the entire US equity universe, over 3000 global ETFs and the LSE FTSE 1000, with content updating every 1 minute. FX and Commodity futures and FX Spot coverage coming soon.
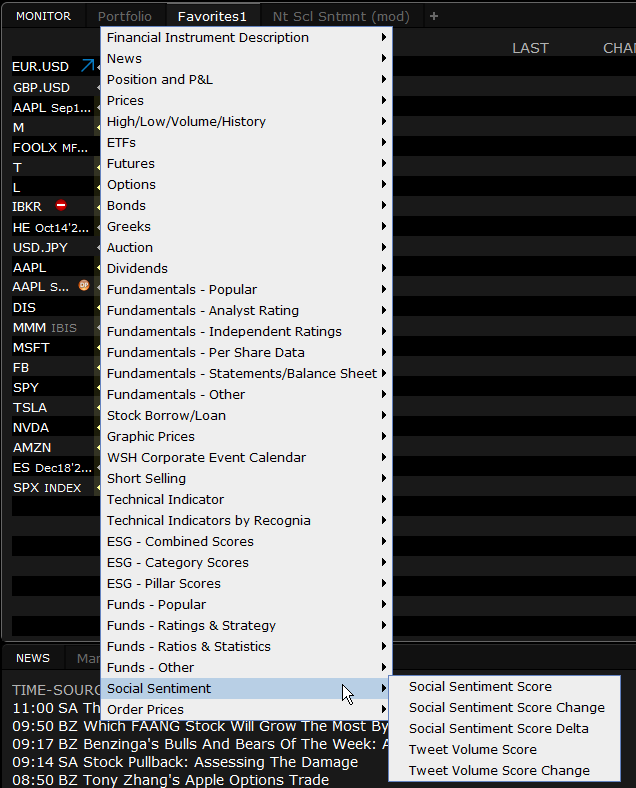
We provide the following data points that you can view in the Social Sentiment widget in the Fundamentals Explorer and in the Social Sentiment columns that you can display in your Watchlists, Scanners, Portfolio and other tools:
- Social Sentiment Score: The normalized, time-weighted summation of sentiment of Tweets from credible accounts across a 24-hour rolling window, at the time of observation. Tweets arriving closer to the observation time carry more weight than those that arrived farther from the observation window. For example, at 09:10 AM, it is the summation of sentiment of tweets received between 09:10 AM the previous day and 09:10 AM today weighted such that the tweets closer to 9:10 AM today are weighted higher.
- Social Sentiment Score Change: From the prior day's average.
- Social Sentiment Score Change: From the prior day's average.
- Tweet Volume Score: Normalized value of Indicative Tweet volume used to compute the social sentiment score, which is the number of unique tweets arriving in a 24-hour interval from certified Social Market Analytics accounts.
- Tweet Volume Score Change: From the prior day's average.
- Tweet Volume Score Change: From the prior day's average.
- Social Sentiment Score Delta (15-Minute Sentiment Change): Change in Social Sentiment Score over a 15 minute look-back period.
- Tweet Source Diversity: Measure of the Tweet source diversity contributing to a sentiment estimate. At the time of observation, this value is calculated as: Number of unique accounts / Tweet Volume Score.
- Social Sentiment Trend chart: See how sentiment is trending over different time periods (1 day, 1 week, 1 month, 6 months and 1 year) with Tweet Volume sub-graph in the bottom panel of the chart.
Social Sentiment Widget in Fundamentals Explorer
Open Fundamentals Explorer from the Mosaic New Window drop-down. In the Fundamentals Explorer, click the Social Sentiment tab to see a graphical representation of data points listed above.

Social Sentiment Columns
Add Social Sentiment columns to your Watchlist and other tools to see the current market sentiment for specific companies. Score and volume values range from -4.25 to 4.25. A score of 3 or higher indicates extremely positive sentiment/high volume. A score -3 or lower indicates extremely negative sentiment/low volume. Column values are color-coded for at-a-glance assessment:

To add columns to a window, hold your mouse over an existing column name until the Insert Column command appears. Click Insert Column and scroll to the Social Sentiment column group. Click a title to add the column to your window. Hold your mouse over a title in the group to see the column definition.