Thumbnail Charts

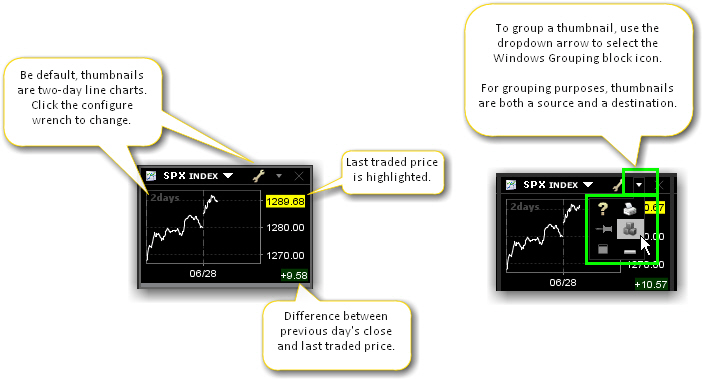
Thumbnails are small floating charts that provide at-a-glance tracking. You can open multiple thumbnail charts for different underlyings, or to show different time periods and intervals.

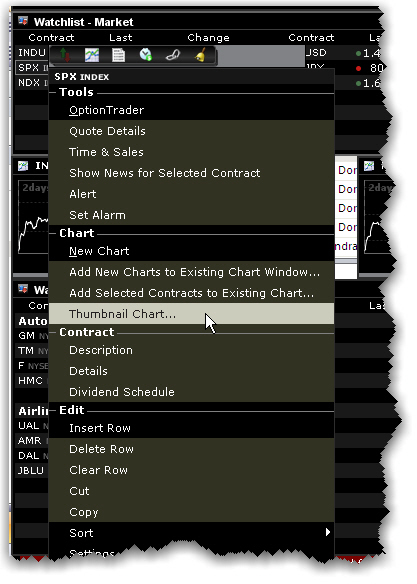
To add a thumbnail chart

  1. From the Watchlist or other window, select the underlying for which you want to open a thumbnail.
  2. Use the right click menu and expand the selection using the Disabled Items arrow at the bottom of the menu.
  3. Select Thumbnail Chart.